Prometheus Integration
Timeplus Enterprise exposes a number of metrics that can be scraped by Prometheus. These metrics can be integrated with dashboards and alerting systems like Grafana or Datadog.
Prometheus Endpoints
By default, Timeplus Enterprise exposes timeplusd metrics on port 9363, and timeplus-connector metrics on port 4196.
| Component | Port | Endpoint | Examples |
|---|---|---|---|
| timeplusd | 9363 | http://timeplusd_address:9363/metrics |
|
| timeplus-connector | 4196 | http://connector_address:4196/metrics |
|
Explore Metrics with Grafana
Grafana is a popular tool for visualizing metrics. Here is a simplified guide to visualize Timeplus Enterprise metrics with Grafana.
Step 1: Install Grafana, Prometheus and Alloy
brew install grafana prometheus
brew install grafana/grafana/alloy
Step 2: Configure Prometheus
Make sure the Prometheus accept remote write. Edit /opt/homebrew/etc/prometheus.args and add --web.enable-remote-write-receiver.
--config.file /opt/homebrew/etc/prometheus.yml
--web.listen-address=127.0.0.1:9090
--web.enable-remote-write-receiver
--storage.tsdb.path /opt/homebrew/var/prometheus
Start Prometheus via brew services start prometheus.
Step 3: Configure Grafana Alloy
Grafana Alloy is the successor of Grafana Agent. It is a vendor-neutral distribution of the OpenTelemetry (OTel) Collector. Edit /opt/homebrew/etc/alloy/config.alloy and add the following:
prometheus.remote_write "default" {
  endpoint {
    url = "http://localhost:9090/api/v1/write"
  }
}
prometheus.scrape "timeplusd" {
  targets = [{
    __address__ = "127.0.0.1:9363",
  }]

  forward_to = [prometheus.remote_write.default.receiver]
}
Alloy will read the metrics from timeplusd and forward them to Prometheus. Start Alloy via brew services start alloy.
Step 4: Configure Grafana
Start Grafana via brew services start grafana. Open http://localhost:3000 in your browser. The default username and password are admin and admin. Add a new Data source with the type of Prometheus and the URL of http://localhost:9090.
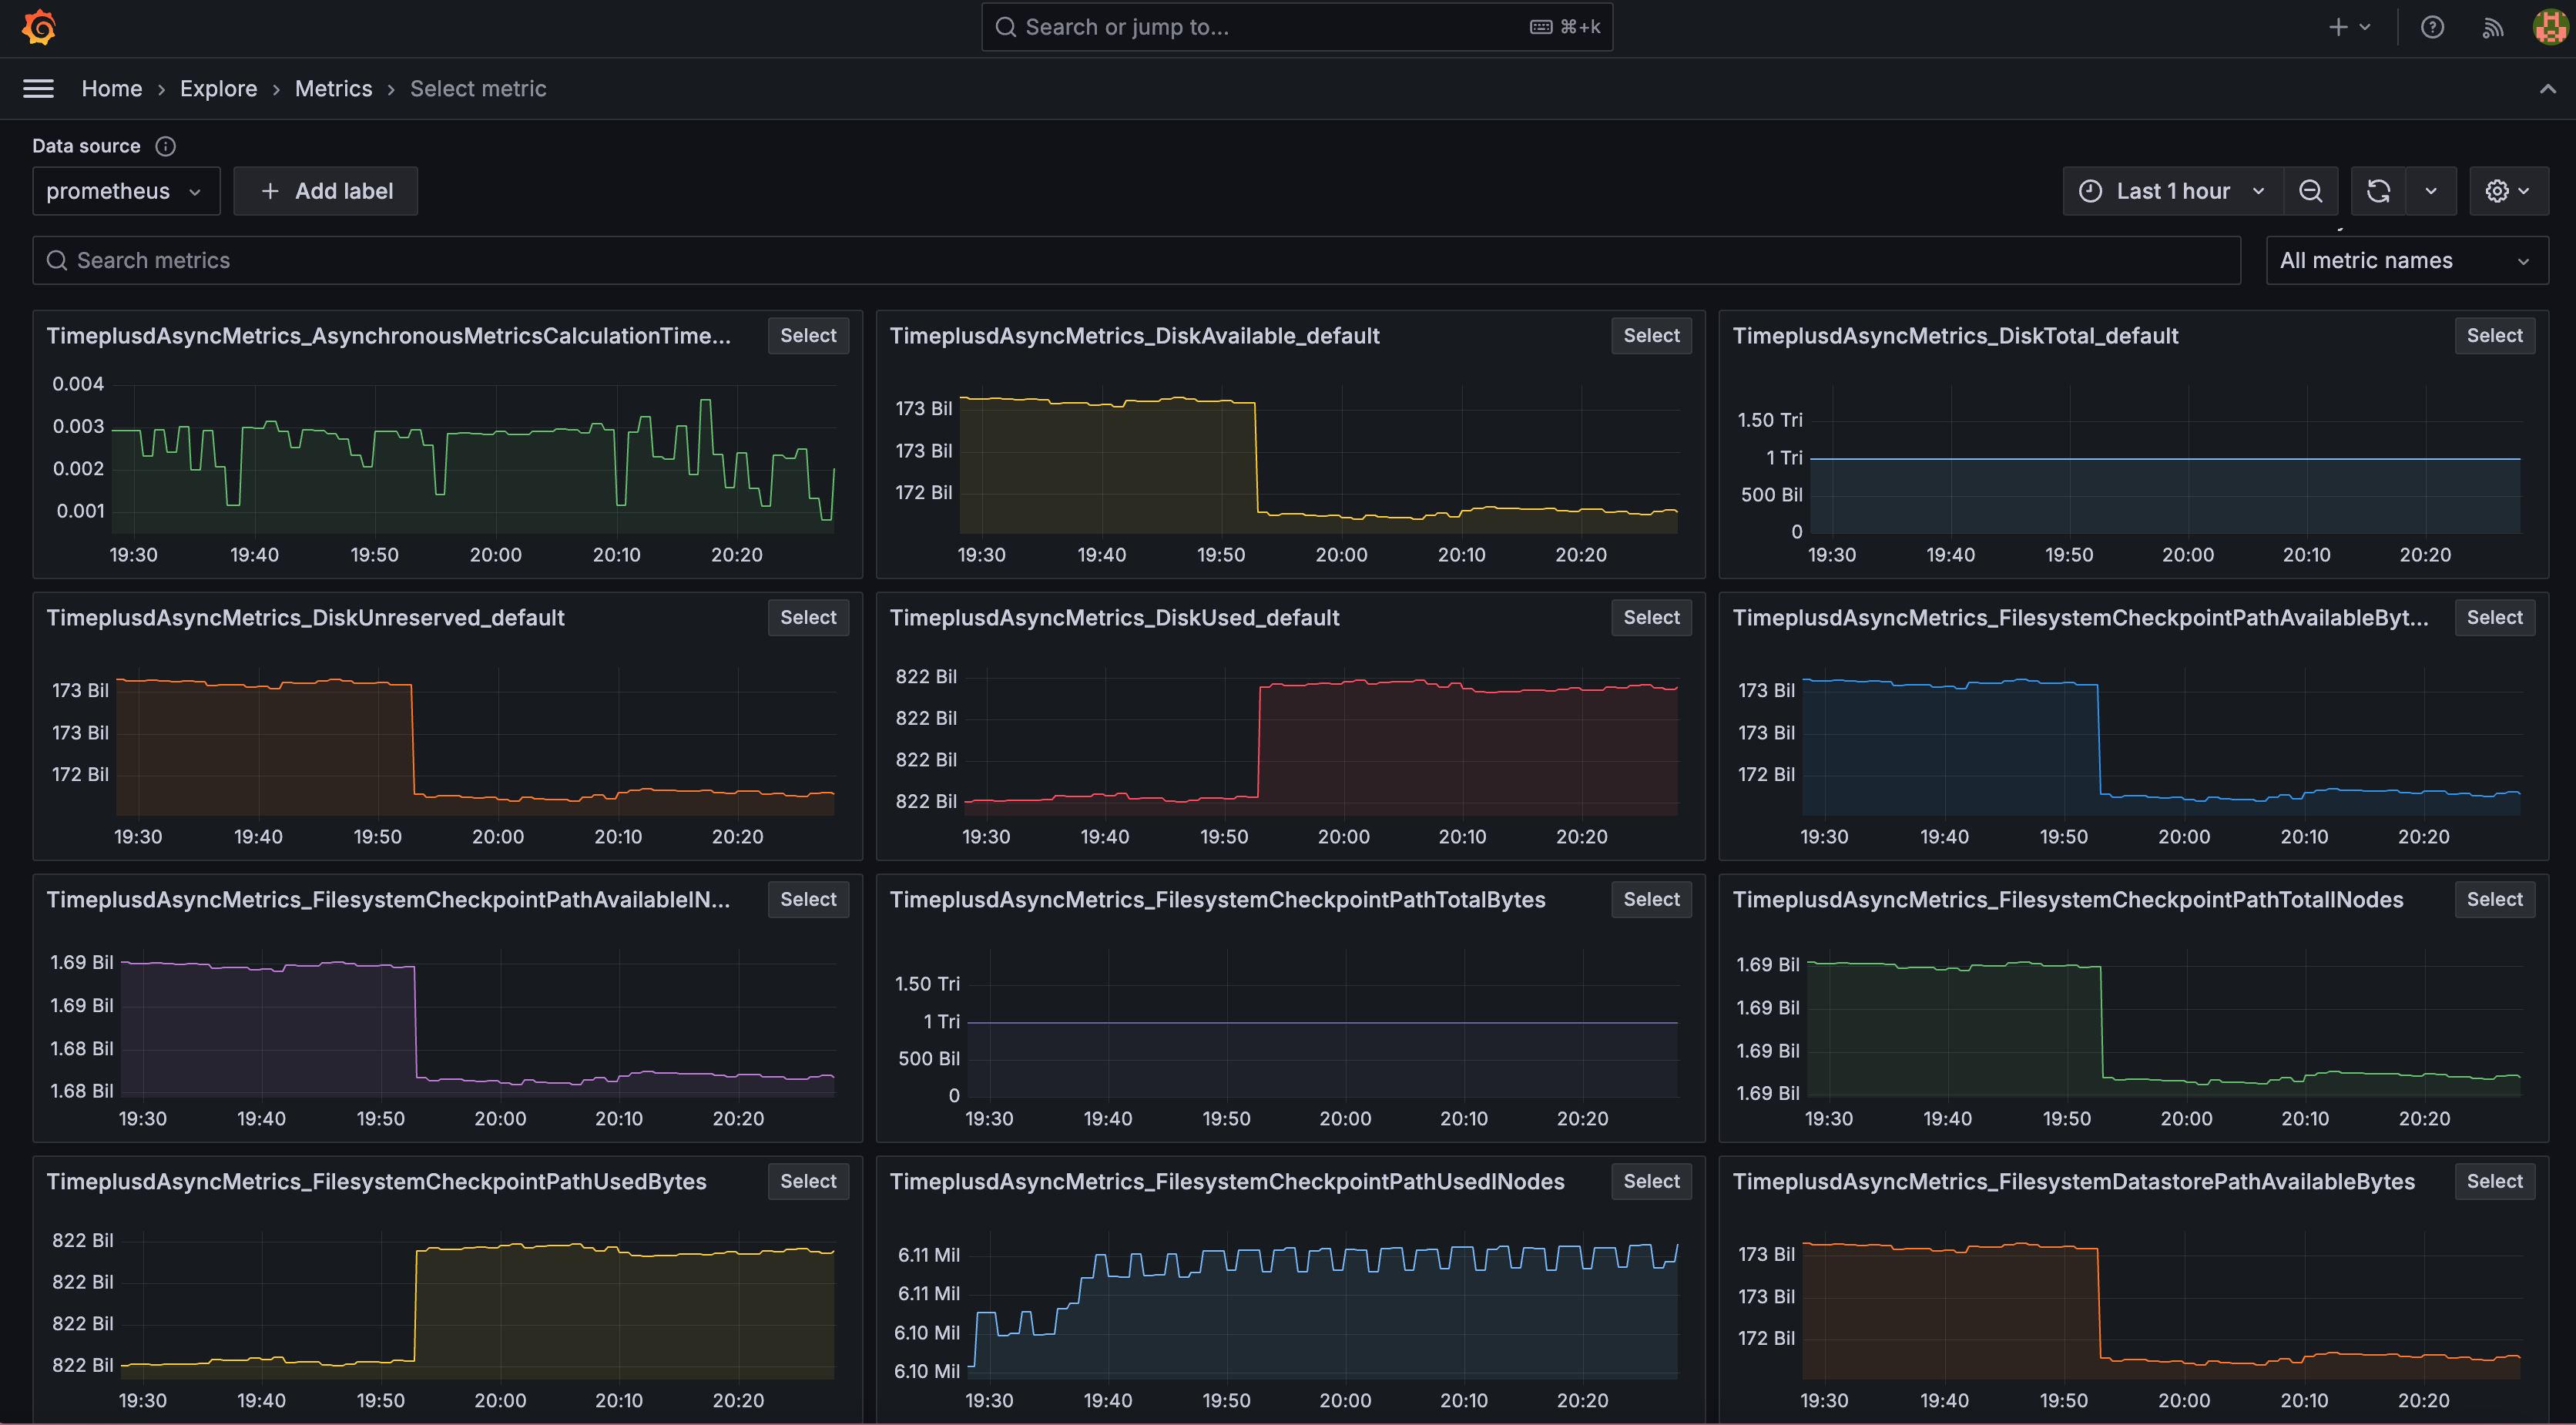
Explore the metrics via http://localhost:3000/explore/metrics.
Contact us if you need help to build Grafana dashboards or alerts with Timeplus Enterprise metrics.